- Knowledge Base
- Tasks with App
- Personalize and customize
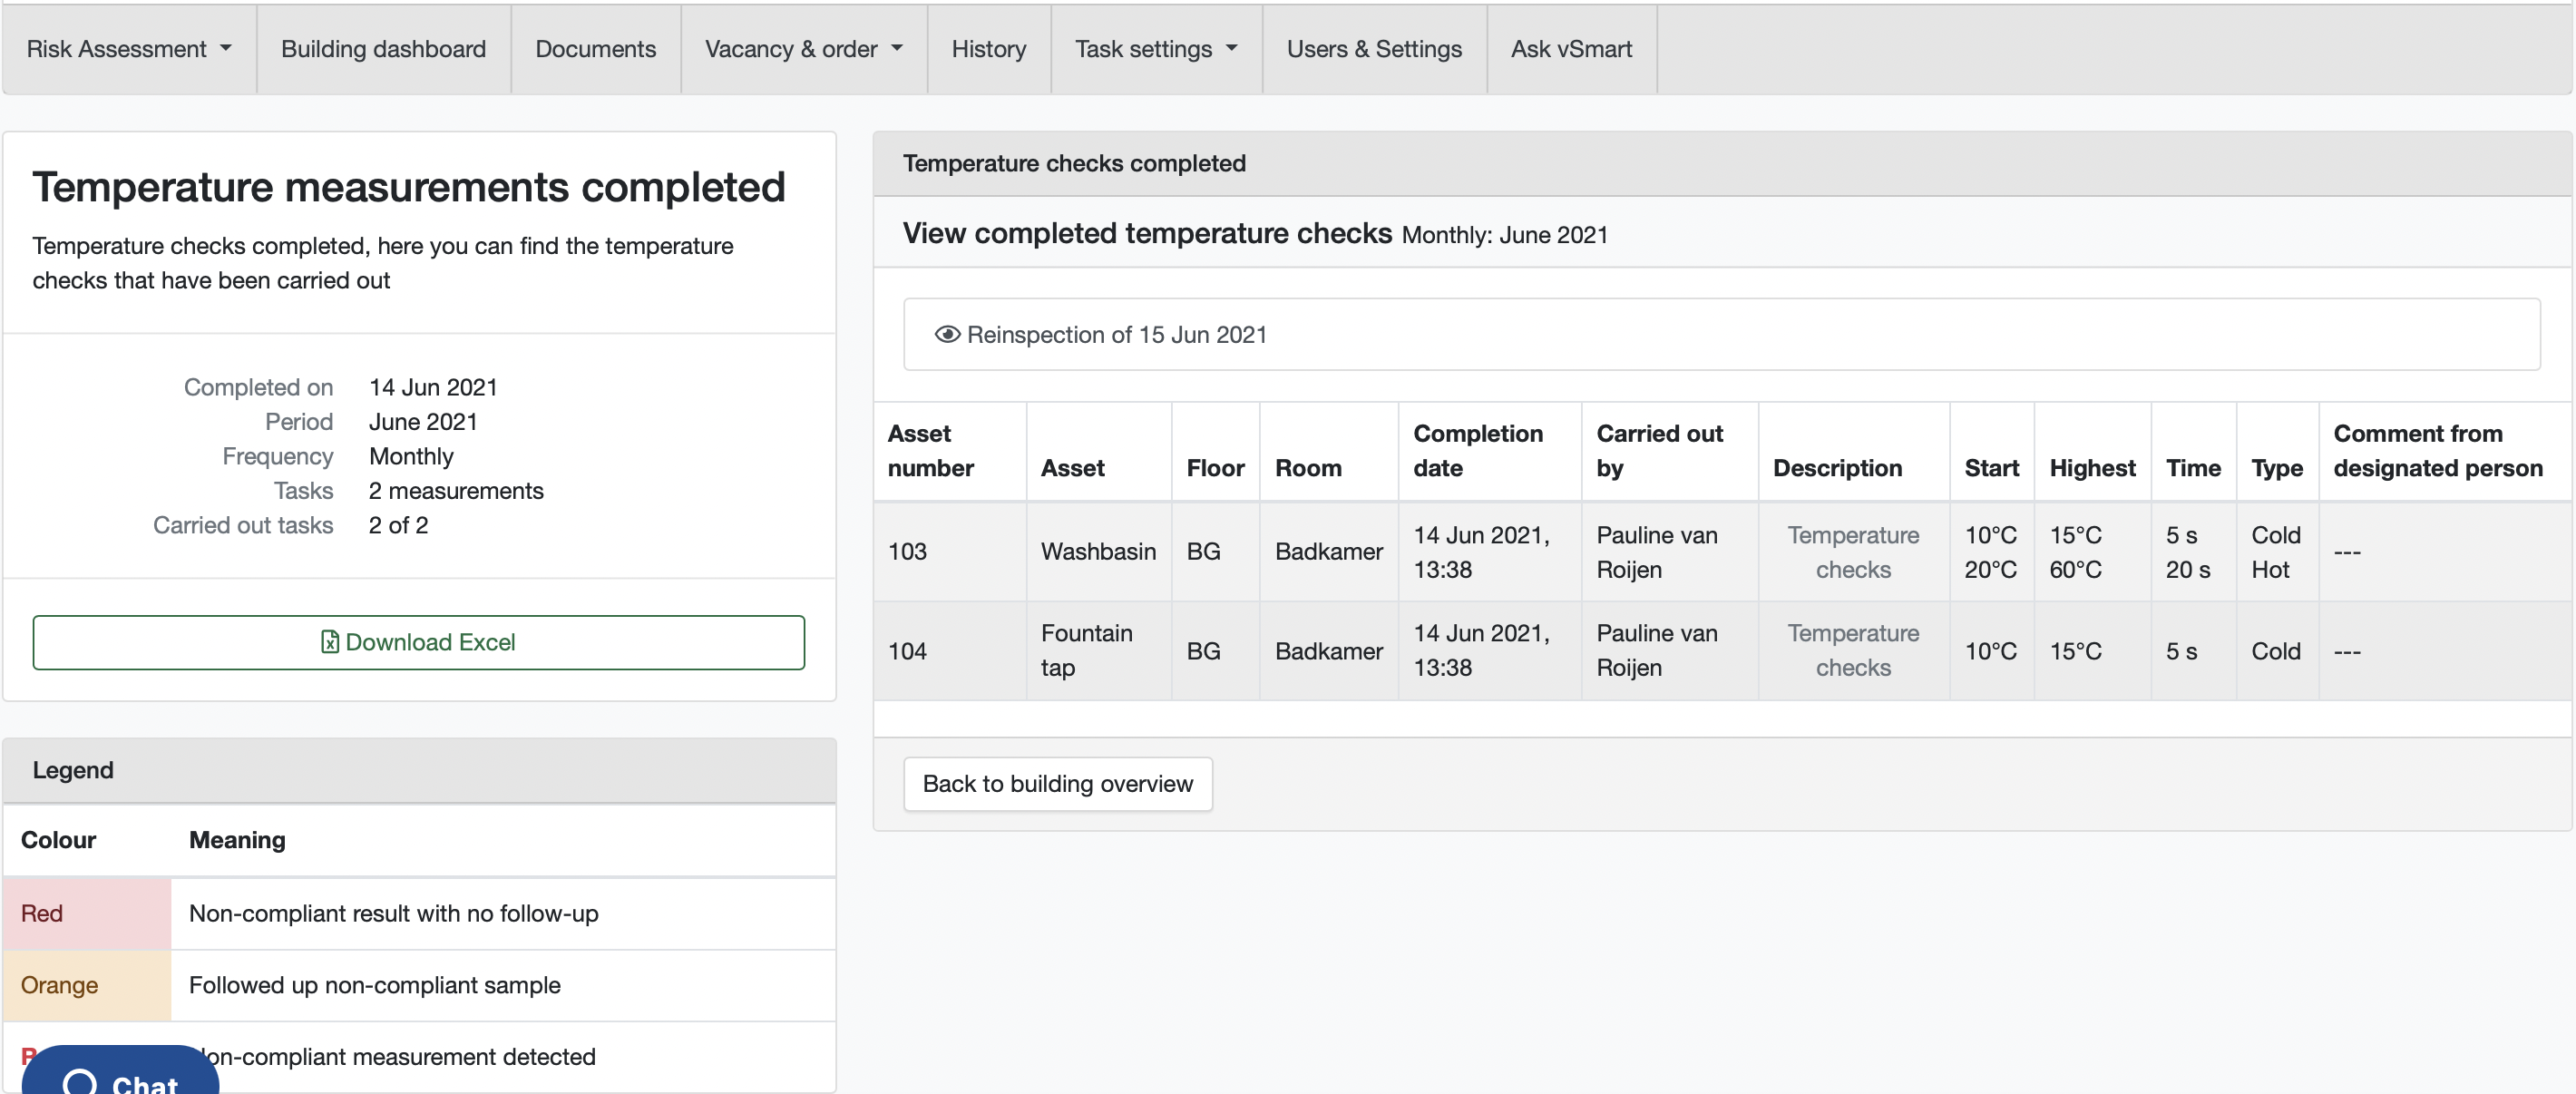
Viewing measuring results online
You can view the results of any measurements you take directly as a graph:
- Click on ‘location dashboard’
- Click the blue button labelled ‘details’ or the option ‘results’ directly above it. You will now see an overview of both tasks that have been performed and tasks that are still outstanding
- Click on the option ‘graph’ next to a finished task to see a visual of the course of the temperature during measurement

